
What are we trying to see?何を見ようとしている?
We wanted to follow points towards the origin and watch their directions remain distinct on the blow-up. A point moving along one line and a point moving along another have the same limit in the plane, but different limits on the exceptional curve. Can we make that correspondence easier to picture by moving the points ourselves?
原点へ近づく点を動かしながら、blow-upの側ではその方向を別々に追ってみたいと思いました。異なる直線に沿って近づく二点は、下の平面では同じ原点に集まりますが、例外曲線上では異なる点へ近づきます。その対応を自分で動かして眺め、図形としてつかむことが今回の狙いです。
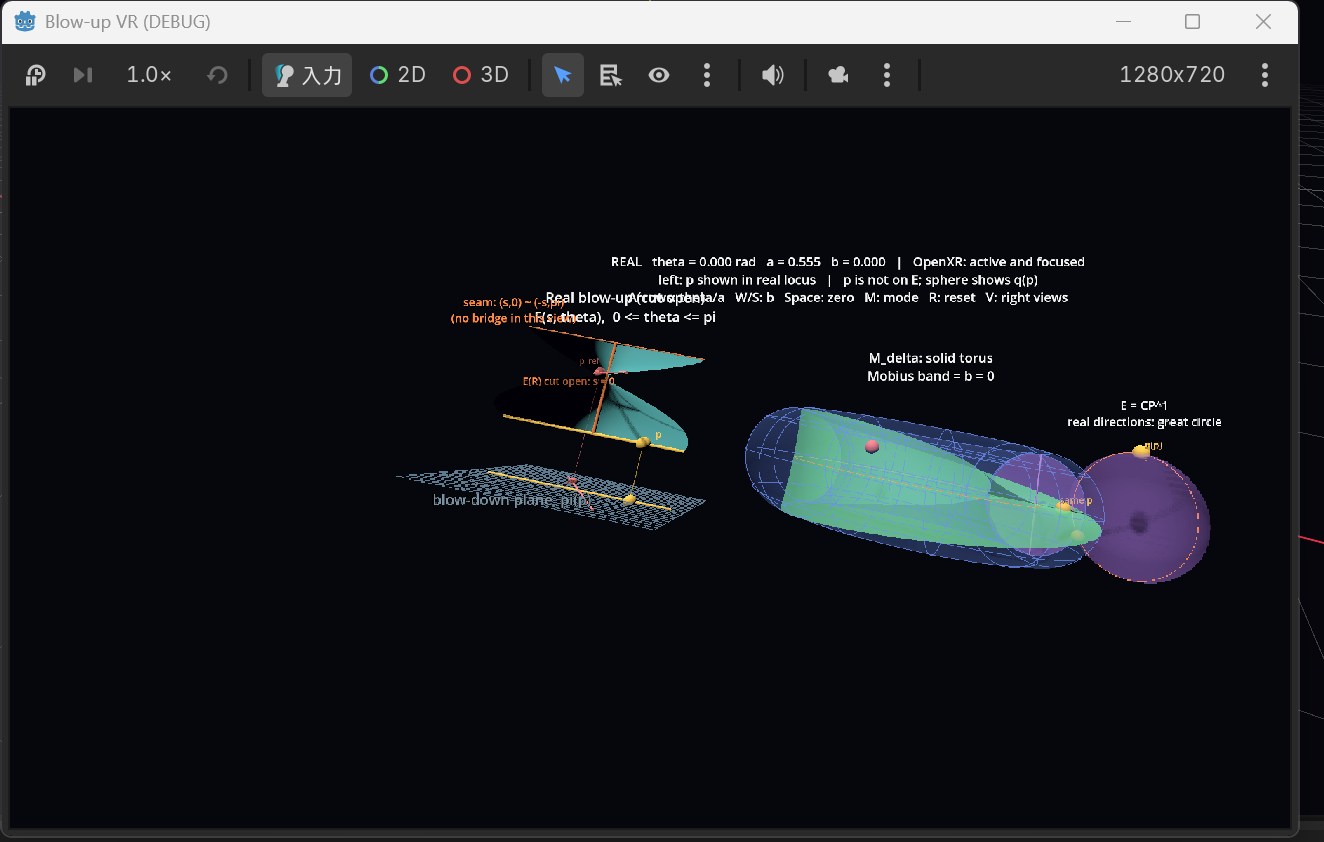
My starting point was a view resembling the cover of Shafarevich’s Basic Algebraic Geometry: a plane below a real blow-up. When I asked Chapio-kun about another way to make the exceptional curve easier to see, it suggested a Möbius-band view. We generated the shapes from formulas rather than reproducing the cover image, and placed the views side by side. I am still comparing how to read them; my current understanding is described below.
私(研究代表)の出発点は、Shafarevich『Basic Algebraic Geometry』の表紙を思わせる、下の平面と、その上に実blow-upの面がある図でした。例外曲線を見やすくする別の表示がないかちゃぴおくんに相談し、メビウス帯として見る案を提案してもらいました。表紙の画像を使うのではなく数式から形を作り、二つを並べています。現在も見比べながら考えており、どこまでつかめているかは後で述べます。
How do we draw it?どう描いている?
We use the standard model of the blow-up of \(\mathbb C^2\) at the origin:
対象は、\(\mathbb C^2\) の原点でのblow-upです。
Here \(\pi\) is the blow-down map and \(q\) records the direction. The curve \(E\) is the exceptional \((-1)\)-curve. Its real locus is \(E(\mathbb R)\simeq\mathbb{RP}^1\). The displays below are designed to compare a point \(p\), its image \(\pi(p)\), and its direction \(q(p)\).
\(\pi\) はblow-down、\(q\) は方向を記録する写像です。この \(E\) が第一種例外曲線(\((-1)\)-curve)で、その実点集合は \(E(\mathbb R)\simeq\mathbb{RP}^1\) です。以下では、点 \(p\)、その像 \(\pi(p)\)、方向 \(q(p)\) を見比べるための表示を説明します。
The real blow-up, cut open実blow-upを切り開いて見る
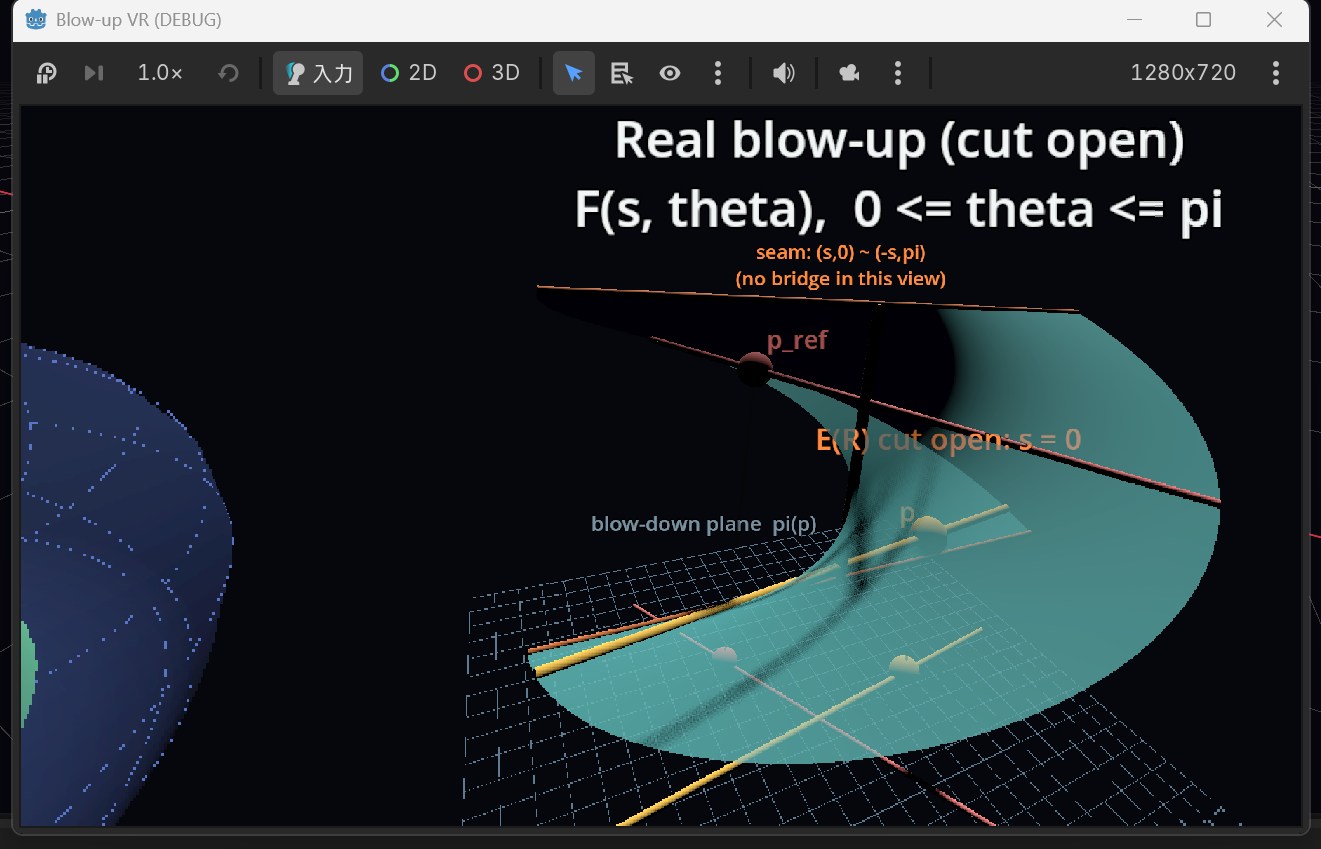
Choose a display range \(\delta>0\). For real points, write \(\ell_\theta=[\cos\theta:\sin\theta]\) and \(z=s(\cos\theta,\sin\theta)\), with \(|s|\leq\delta\) and \(0\leq\theta\leq\pi\). The lower point is drawn in the plane; the lifted point is drawn using
表示する範囲を \(\delta>0\) で定めます。実点では、\(\ell_\theta=[\cos\theta:\sin\theta]\)、\(z=s(\cos\theta,\sin\theta)\) と書き、\(|s|\leq\delta\)、\(0\leq\theta\leq\pi\) を動かします。下には平面上の点を、上には次の表示で持ち上げた点を描きます。
The constants \(h_0,c>0\) set the height used in this display. The edges are left apart so that we can inspect the cut; the identification is \((s,0)\sim(-s,\pi)\). The vertical segment at \(s=0\) is the cut-open display of the real exceptional locus \(E(\mathbb R)\).
\(h_0,c>0\) は表示の高さを決める定数です。二つの端を離して描き、貼り合わせ \((s,0)\sim(-s,\pi)\) を見比べられるようにしました。\(s=0\) の縦線は、例外曲線の実点集合 \(E(\mathbb R)\) を切り開いた表示です。
A Möbius band inside a solid torusソリッドトーラスの中にメビウス帯を置く
On the right we show the bounded real three-dimensional part
右側には、次の有限範囲の実3次元部分を表示します。
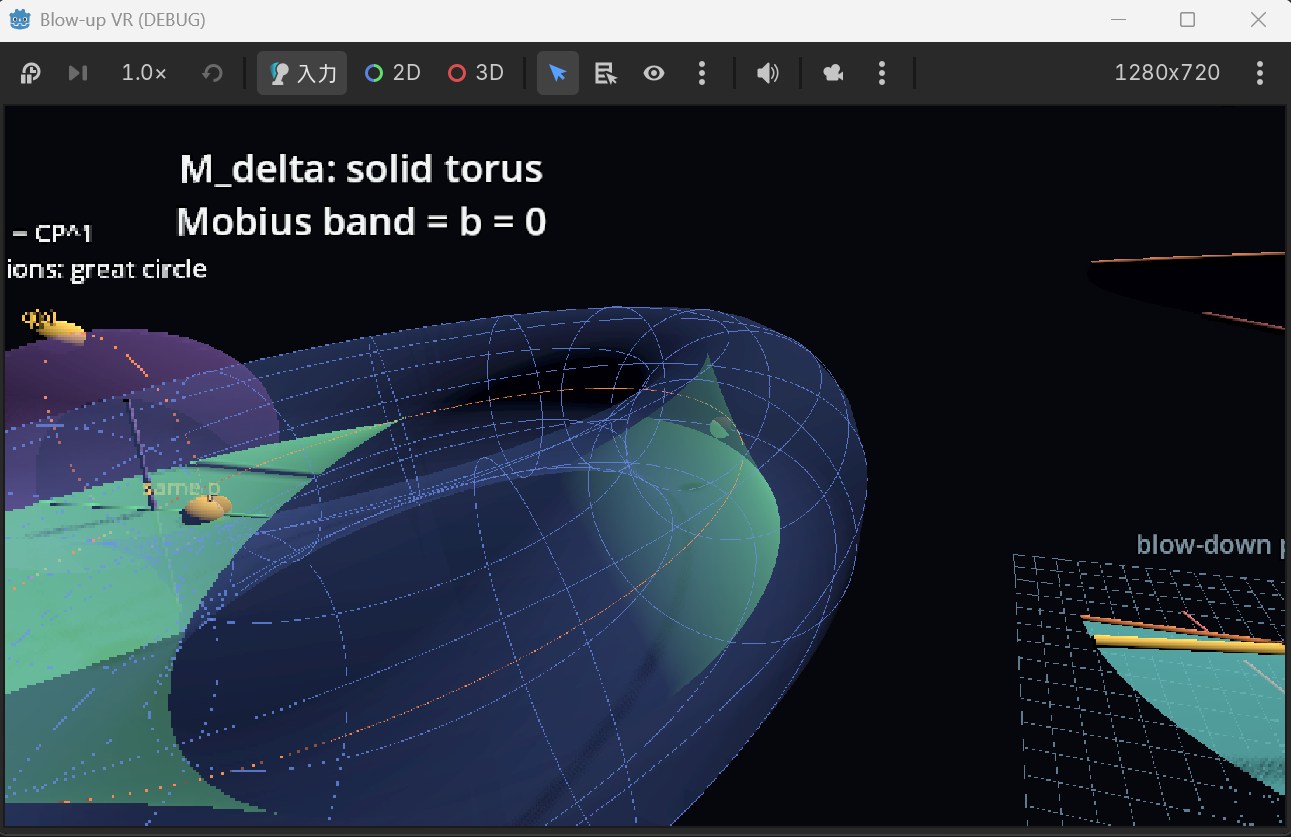
Write \(z=(a+ib)(\cos\theta,\sin\theta)\), where \(a^2+b^2\leq\delta^2\). Gluing \((\theta,\lambda)\sim(\theta+\pi,-\lambda)\), with \(\lambda=a+ib\), gives the solid torus. Its real part \(b=0\) is the same real blow-up, now displayed as a Möbius band. Its core circle corresponds to the vertical segment in the left-hand view.
\(z=(a+ib)(\cos\theta,\sin\theta)\)、\(a^2+b^2\leq\delta^2\) と書きます。\(\lambda=a+ib\) に対する貼り合わせ \((\theta,\lambda)\sim(\theta+\pi,-\lambda)\) で得られるソリッドトーラスの内部に、実点部分 \(b=0\) がメビウス帯として入ります。左で切り開いて見ていた実blow-upの、もう一つの表示です。芯の円が、左の縦線に対応します。
For a fixed direction, the complex fibre is shown as a disk. The diameter \(b=0\) lies in the Möbius band, so varying \(b\) lets us move off the real part into the disk.
方向を固定した複素ファイバーは円板として見えます。その直径 \(b=0\) がメビウス帯との交わりなので、\(b\) を動かすと、実点部分から円板の虚方向へ離れていく様子を追えます。
The exceptional curve as a Riemann sphere第一種例外曲線をリーマン球面として見る
We display the exceptional \((-1)\)-curve \(E\simeq\mathbb{CP}^1\) as a Riemann sphere, topologically \(S^2\), and mark the direction \(q(p)=\ell_\theta\) on it. The real locus \(E(\mathbb R)\) corresponds to a great circle. The display links this direction with the cut-open model and the core of the solid torus.
第一種例外曲線 \(E\simeq\mathbb{CP}^1\) をリーマン球面(位相的には \(S^2\))として描き、選んだ方向 \(q(p)=\ell_\theta\) を示します。実点集合 \(E(\mathbb R)\) は大円に対応します。この方向を、左の切り開き表示・ソリッドトーラスの芯・リーマン球面の大円で連動させる設計です。
What can we compare by moving the points?点を動かして、何を見比べる?
In the real mode, move \(a=s\) towards zero while comparing two directions. The two images below meet at the origin, while the marked points on the blow-up retain their directions. We wanted to follow this change continuously, rather than switch between unrelated drawings.
実数モードでは二つの方向を比べながら、\(a=s\) を0へ近づけます。下の二点が同じ原点に集まる一方、blow-upの側では異なる方向が残ります。別々の図を眺めるだけでなく、その変化を連続的に追えるようにしたかったのです。
The controller changes the direction and the position along the fibre. We can also move into the imaginary direction in the disk, or set \(a=b=0\) while retaining \(\theta\). When \(b\ne0\), the selected point leaves the real part, so its marker in the left-hand real model is hidden; the solid-torus point and sphere direction remain linked.
コントローラーで方向とファイバー上の位置を動かし、円板の虚方向へ移ったり、\(\theta\) を保って \(a=b=0\) に戻したりできます。\(b\ne0\) では選択点が実点部分から外れるため、左の実blow-upではその点の表示を隠し、右の点と球面の方向を引き続き連動させます。
How did we build it with Chapio-kun?ちゃぴおくんと、どう作った?
My first request to Chapio-kun was for an interactive view resembling the cover of Shafarevich’s Basic Algebraic Geometry. I described the plane, the real blow-up above it, and the points and directions I wanted to move, in Japanese and with formulas.
最初に私からちゃぴおくんへ頼んだのは、Shafarevich『Basic Algebraic Geometry』の表紙を思わせる図を、点を動かしながら眺められるようにすることでした。下の平面とその上の実blow-upをどう並べ、どの点や方向を動かしたいかを、日本語と数式で伝えました。
I then asked whether there was another way to make the exceptional \((-1)\)-curve easier to see. Chapio-kun suggested a Möbius band inside a solid torus, together with references. This was not a visualization method I had known or specified at the outset. I asked for it to be placed beside the first view so that I could try comparing them.
その後、第一種例外曲線をもう少し見やすくする別の表示がないか相談したところ、ソリッドトーラスの中にメビウス帯を置く見方を、参考文献とともに提案してもらいました。これは私が最初から知っていて指定した描画方法ではありません。まず試してみようと考え、表紙風の表示の隣に並べてもらいました。
Chapio-kun also turned the discussion into a brief for Codex, adding technical details and proposed controls. I did not first master VR programming or decide the file structure myself. Some parts of the brief still require reading and checking; I am using the implemented views to compare what appears with my original intentions. After seeing them, I also asked to move closer, look up from below and move around the models.
相談をCodexへの依頼資料にまとめ、技術的な指定や操作案を補うことも、ちゃぴおくんに頼みました。VRのプログラミングやファイル構成を先に習得したわけではなく、依頼資料にはまだ読み切れていない・確認できていない部分もあります。まず表示してもらい、当初の意図と合うかを見ながら進めています。実際に眺めてから、もっと近づきたい、低い位置から見上げたい、横へ回り込みたいという操作も追加で頼みました。
What has become clear to me so far?現在、私がどこまでつかめているか
In the view inspired by Shafarevich’s cover, I can follow the relation between points approaching the origin and their directions in the way I intended. The Möbius-band view inside the solid torus has not yet become equally intuitive to me. I am still comparing the two views and moving the points and directions to understand how to read it.
Shafarevichの表紙を思わせる表示については、原点へ近づく点と方向の対応を、私が意図したとおりに追えることを確認できています。一方、ソリッドトーラス内のメビウス帯として見る表示は、まだ「なるほど、こう見ればよいのか」と腑に落ちた段階には至っていません。現在も二つを見比べ、点や方向を動かしながら考えているところです。
What would we like to explore next?この先、何を見たい?
This is a starting point for comparing complex-geometric objects with real models we can move around. We would like to explore torus-invariant objects, including toric spaces and Reinhardt domains, alongside convex or other real-coordinate pictures.
この図を出発点に、複素幾何の対象を、動かして眺められる実の模型と結び付けていきたいと考えています。toricな対象やラインハルト領域など、トーラス不変なものと凸図形などの実領域を見比べる方向にも関心があります。
Further ahead, we would like to explore how to visualize a Kähler–Ricci flow on a one-point blow-up of \(\mathbb{CP}^2\), starting in a Kähler class for which the exceptional \((-1)\)-curve contracts. This is motivated by the analytic minimal model program, which seeks to realize birational operations through geometric flow. We have not implemented this yet.
さらに将来は、\(\mathbb{CP}^2\) の一点blow-up上で、第一種例外曲線が収縮する初期Kähler類を選び、そのKähler–Ricci flowを3D VRでどう眺められるか考えてみたいと思っています。極小モデルプログラム(MMP)の双有理変換を幾何学的な流れから捉える、analytic MMPへの関心からです。これは今後の構想で、まだ実装していません。
For background, see §§7.3–7.4 and §8 of Song and Weinkove’s Lecture notes on the Kähler–Ricci flow, arXiv:1212.3653.
この背景については、Song–Weinkoveの講義録 Lecture notes on the Kähler–Ricci flow(arXiv:1212.3653)の§7.3–7.4と§8が参考になります。
The initial request and references初回依頼資料と参考文献
These PDF and TeX files are an implementation brief prepared by Chapio-kun from our discussion. They combine my mathematical requests with visualization proposals, technical details and references added by AI. I did not write every specification myself, and have not fully checked every detail or reference. The files are preserved as records of the initial request, not as fully reviewed manuals or reports of completed tests. See also how to read the implementation briefs.
ちゃぴおくんに対話からまとめてもらった実装依頼資料を、PDFとTeXで置いています。私の数学的な希望に、AIが提案した表示案、技術的な指定、参考文献が加わったものです。すべての仕様を私が書いたものでも、細部や文献をすべて確認済みの解説書でもありません。初回依頼の記録として、ファイルは当時のまま掲載しています。依頼資料の読み方もご覧ください。
The starting image着想の出発点
I. R. Shafarevich, Basic Algebraic Geometry.
My starting point was the image on the cover. The aim was to try a view recalling that image, not to reproduce a particular published implementation.
出発点は、この本の表紙を思わせる図を自分で動かして眺めたい、という希望でした。特定の実装を再現するところから始めたわけではありません。
References added to the brief by Chapio-kunちゃぴおくんが依頼資料に挙げた文献
The brief lists the following mathematical references, along with Godot documentation. They are distinct from my original starting point. I have not checked every detail, including which parts support the particular display formulas used here; they are listed as references suggested during the conversation, not as sources I had already worked through before designing the view.
依頼資料には、Godotの文書とともに、次の数学的な資料が挙げられています。これらは私が最初から参照して構想した文献とは区別しています。今回の描画式と各文献の具体的な対応も含め、私が隅々まで確認したわけではないため、対話の中で提案された関連資料として紹介します。
- The Stacks Project, “Blowing up” (Tag 01OF)
- Markus Brodmann and Peter Schenzel, Families of Blowups of the Real Affine Plane: Classification, Isotopies and Visualization, arXiv:1811.06710.
For the setup, see Start from zero. Our Notes describe the use of AI across the project.