
What are we trying to see?何を見ようとしている?
Choose a point in the first projection of a domain \(\Omega\subset\mathbb C^2\). What does the fibre above it look like? Move the point, and we can watch that fibre change. The starting idea was to turn Kiyoshi Oka’s “ryokuinzu” into a diagram we can explore by moving through it.
\(\mathbb C^2\) の領域 \(\Omega\) を考え、その第一射影の中で一点を選ぶと、そこにあるファイバーはどんな形でしょう。点を動かせば、その変化を眺められます。出発点は、岡潔の「緑陰図」を、点を動かして観察できる図にしたいという発想でした。
We keep the path in the left-hand \(z\)-plane and arrange its fibres vertically on the right. The gold point and gold section mark the same position along the path. We can compare a single fibre with the shape of the whole family.
左には \(z\) 平面の経路を残し、右にはその経路上のファイバーを高さ方向に並べます。金色の点と金色の断面が、経路上の同じ位置を表します。一つのファイバーと、ファイバーの集まり全体の形を見比べるための表示です。
- For the same domain, what changes in the family of fibres when we choose a different path?同じ領域でも、経路を変えるとファイバーの集まりはどう変わるでしょうか。
- How does one fibre fit into the family along the whole path?一つのファイバーと、経路に沿う族全体をどう対応づけて見るとよいでしょうか。
- How do the domain’s defining inequalities appear in the radii, centres and holes of its fibres?領域の定義式は、ファイバーの半径・中心・穴の有無にどう表れるでしょうか。
Left: a path in \(\Omega_1\)左:第一射影 \(\Omega_1\) の中の経路
Gold: the fibre at the selected point金色:選んだ点でのファイバー
Height: position along the path高さ:経路に沿って進んだ位置
How do we draw it?どう描いている?
Write the two complex coordinates as \((z,w)\). The first projection and the fibre at \(z\) are
複素座標を \((z,w)\) と書きます。第一射影と、点 \(z\) におけるファイバーは、
Choose a path of positive finite length, \(\gamma:[0,1]\to\Omega_1\), parametrized by normalized arc length. The right-hand view represents
正で有限の長さをもつ経路を、正規化した弧長でパラメータづけ、\(\gamma:[0,1]\to\Omega_1\) と書きます。右側には次の集合を表示します。
The two horizontal coordinates are \(\operatorname{Re}w\) and \(\operatorname{Im}w\); height is \(t\). The gold section is \(\Omega_{\gamma(t)}\times\{t\}\). If a path returns to the same base point, its fibre appears again at a different height.
水平面の二つの座標が \(\operatorname{Re}w\)、\(\operatorname{Im}w\)、高さが \(t\) です。金色の断面は \(\Omega_{\gamma(t)}\times\{t\}\) に対応します。同じ底点をもう一度通れば、そのファイバーは別の高さにも現れます。
Here \(t\) is normalized arc length, not elapsed clock time. The display follows a chosen real one-dimensional path in the base; it does not show all of the four-real-dimensional domain at once.
ここで \(t\) は経路の弧長を0〜1に正規化した値で、時計の時間ではありません。底の中の実1次元の経路に沿った表示なので、実4次元の領域全体を一度に表示しているわけではありません。
Start with a straight lineまず、直線上で動かす
First take a line through the origin. Its direction is selected with the pointer; playback or the slider moves the gold point along the displayed segment. In the unit ball, the disc fibre grows towards the origin and shrinks towards the edge.
まずは原点を通る直線を考えます。ポインターで方向を指定し、再生ボタンやスライダーで、その線分上の点を動かします。単位球では、原点に近づくにつれて円板のファイバーが大きくなり、端へ進むと小さくなります。
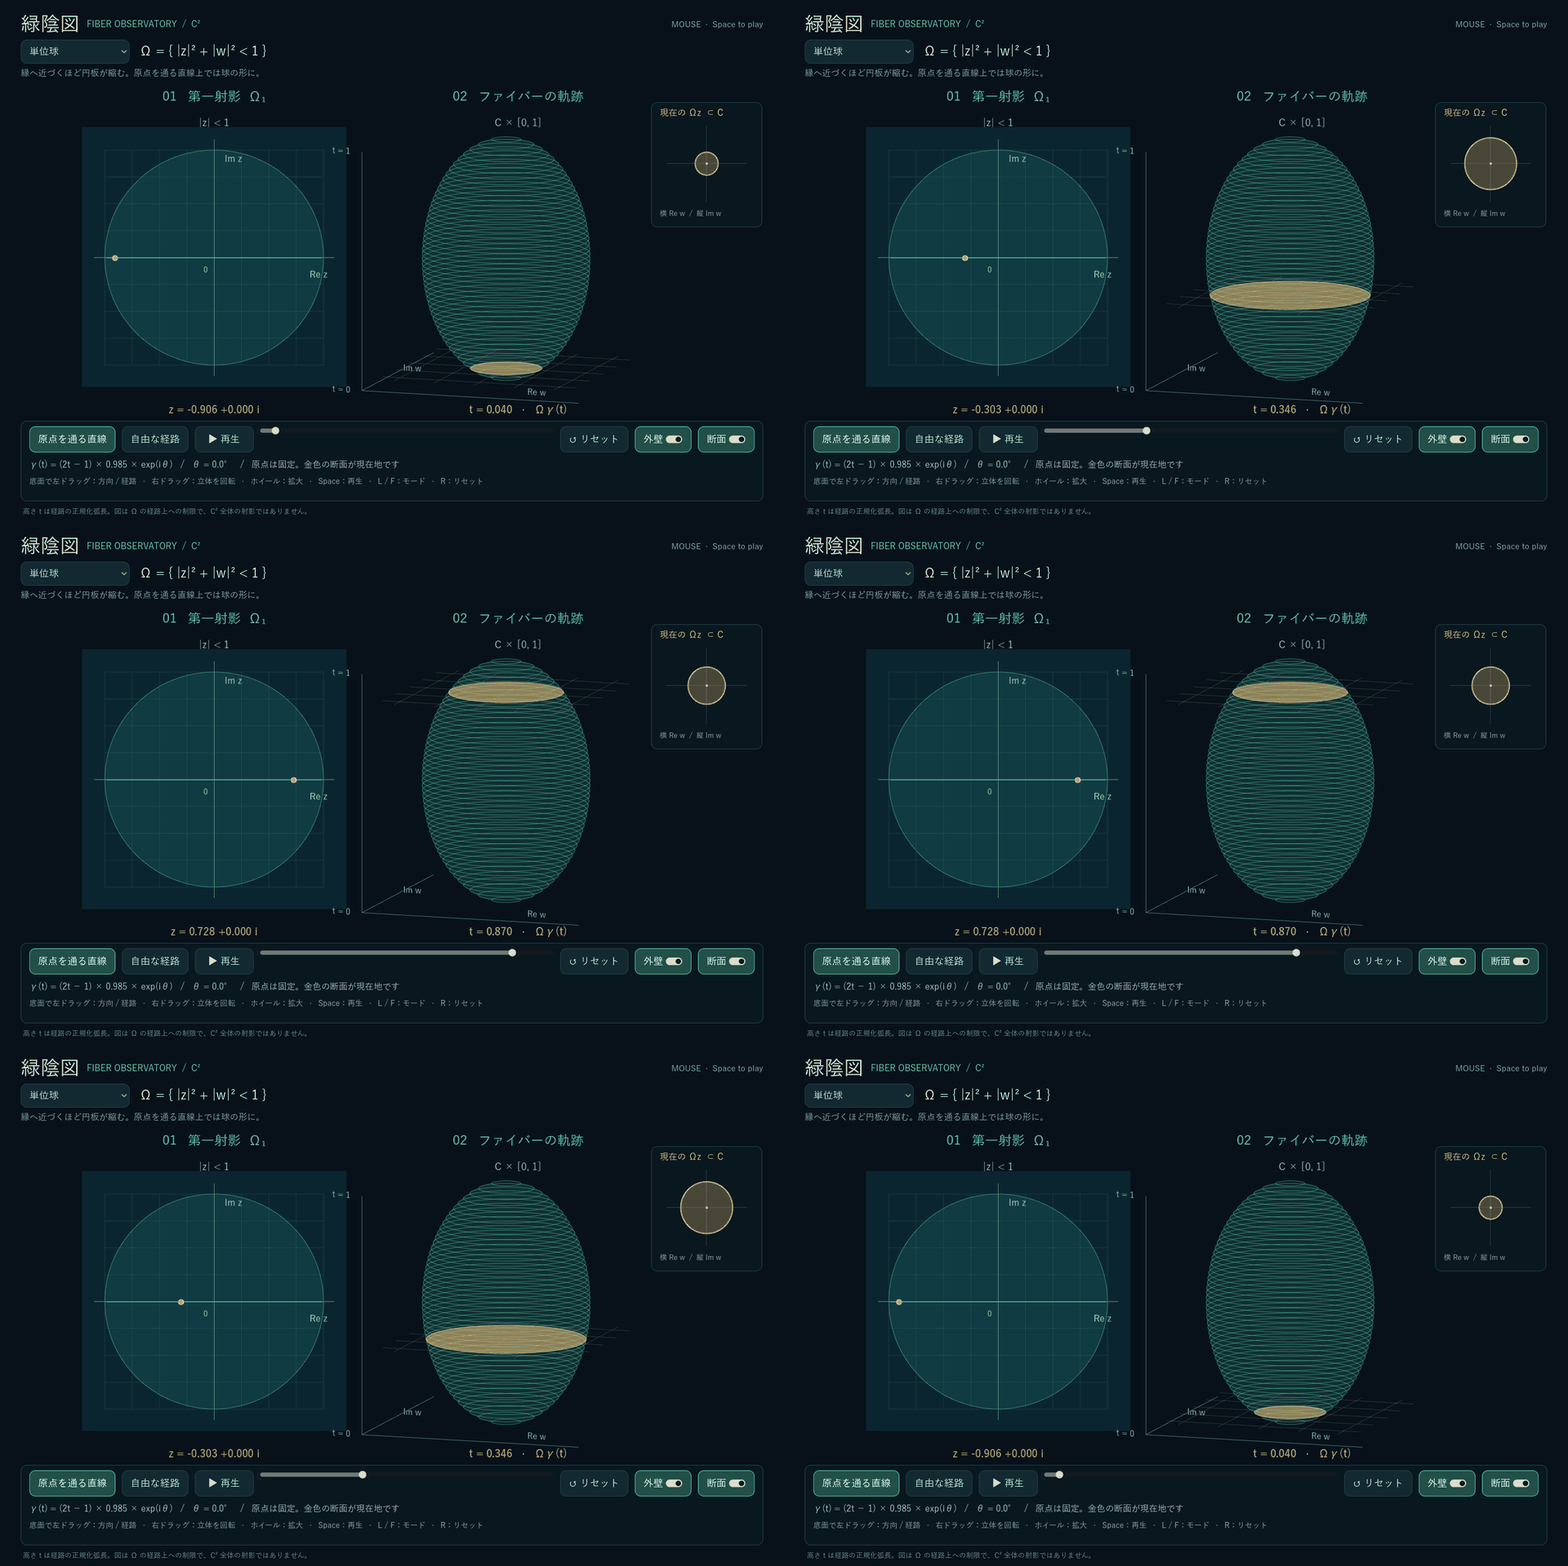
Play the GIF version (close to stop)GIF版を見る(閉じると停止)
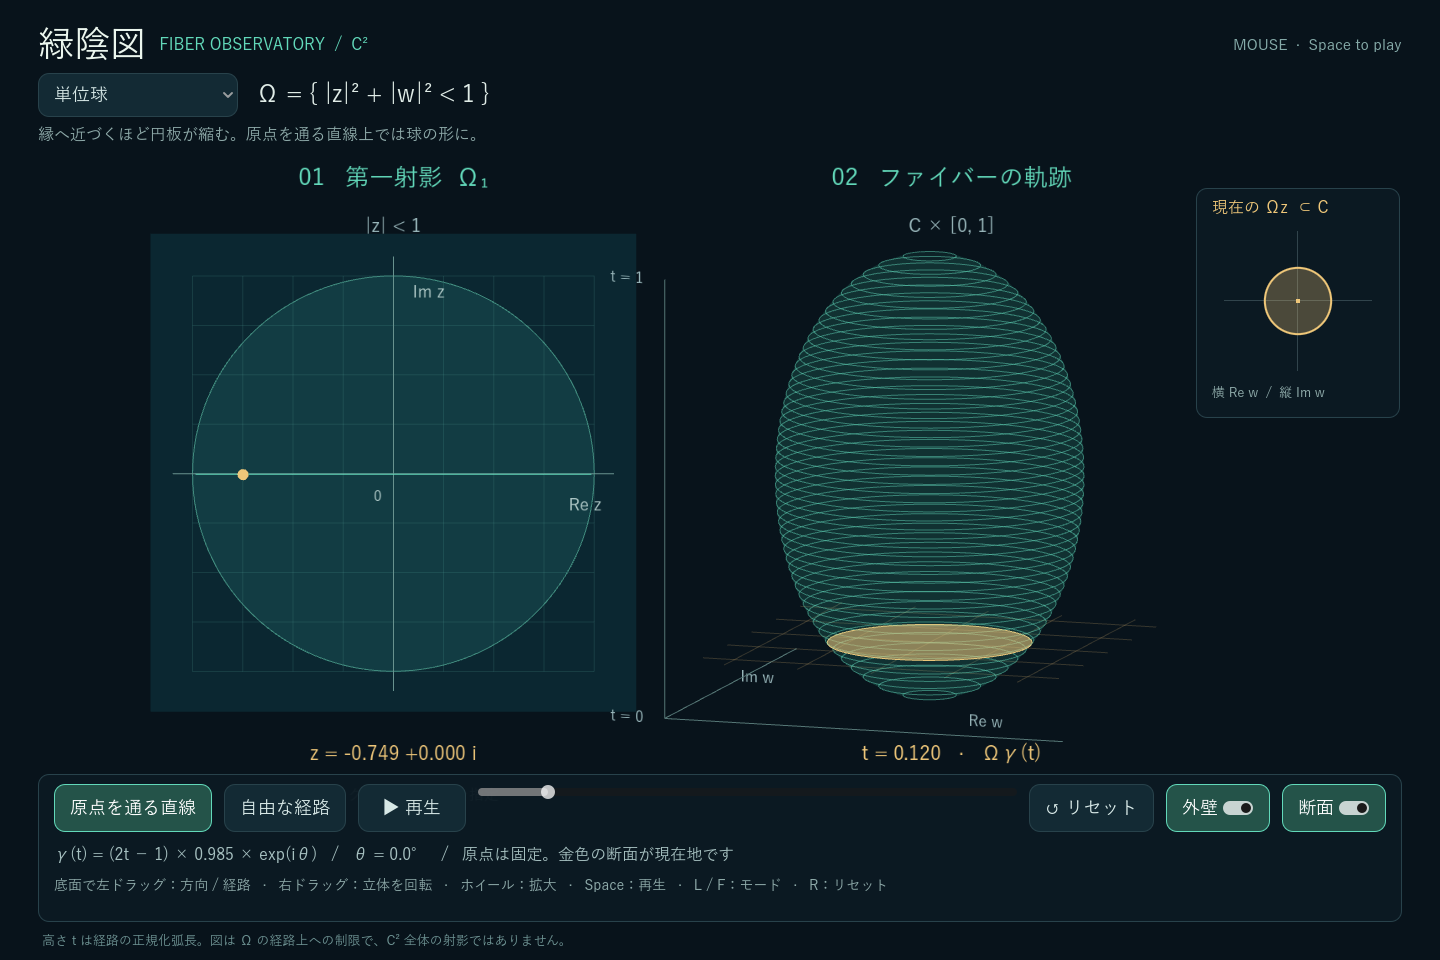
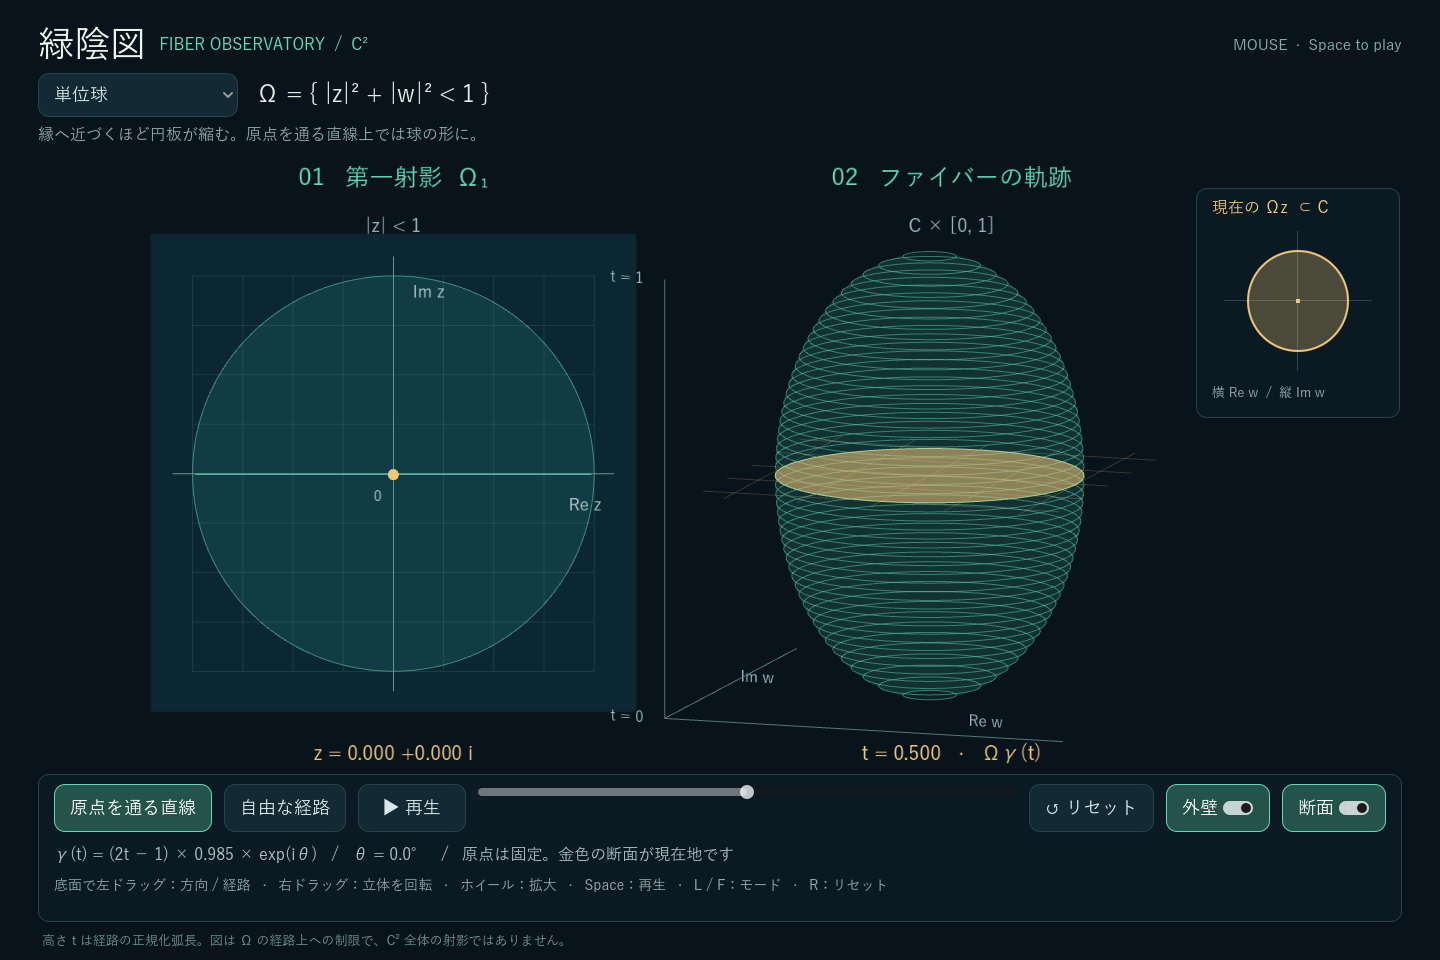
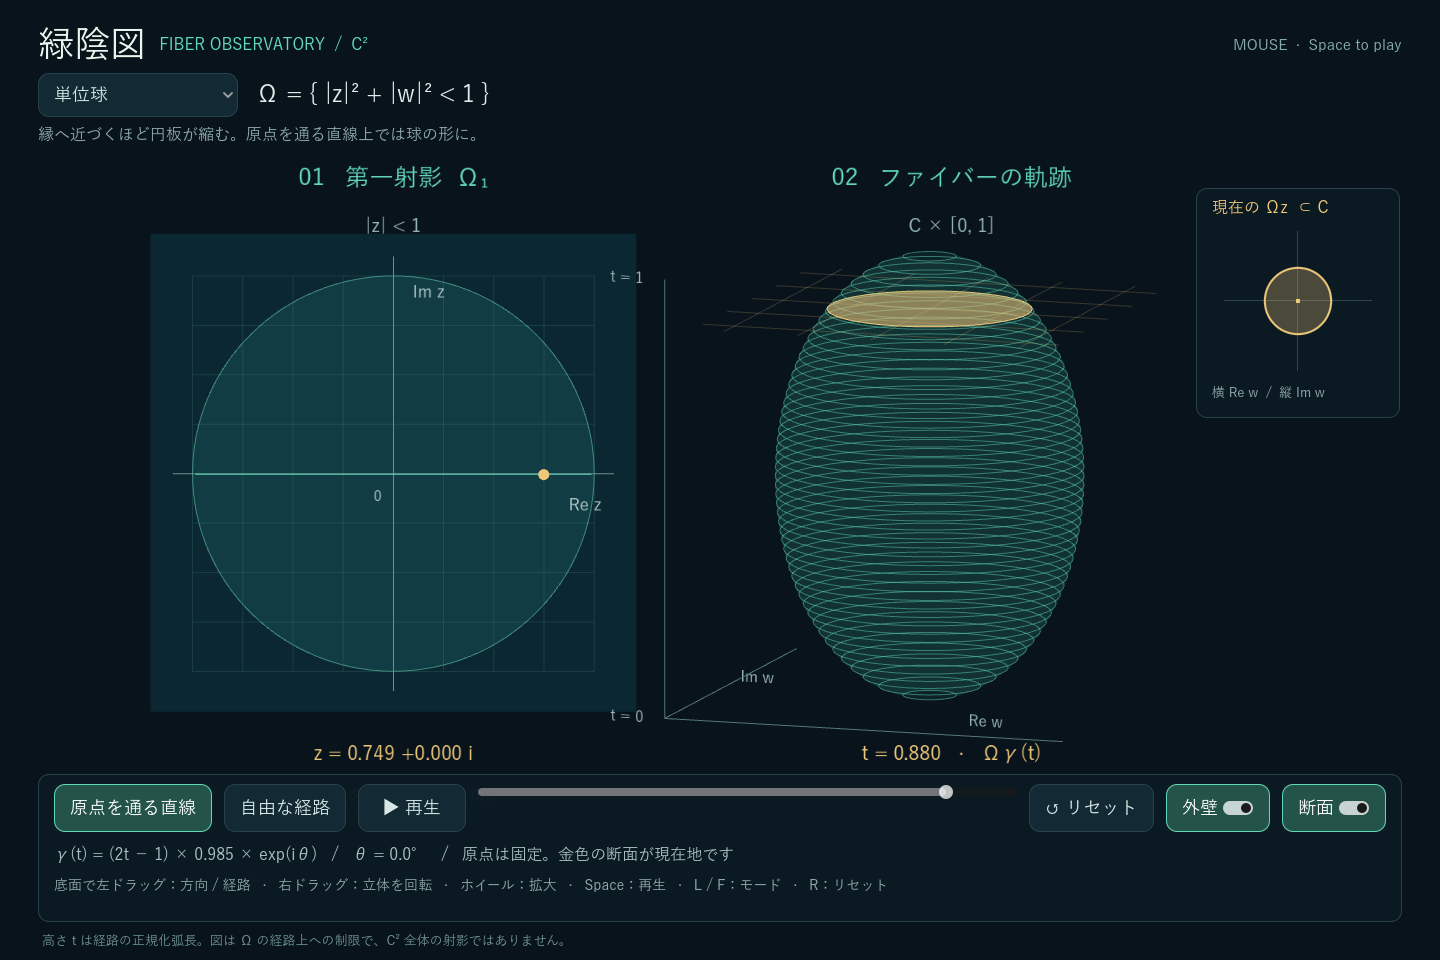
The displayed segment stops just inside the unit circle: \(\gamma(t)=0.985(2t-1)e^{i\theta}\). This keeps the sampled points in the open projection.
表示する線分は単位円の少し内側までとし、\(\gamma(t)=0.985(2t-1)e^{i\theta}\) としています。標本点が開集合である第一射影の中に入るようにするためです。
Draw a path, stack its fibres経路を描き、ファイバーを積み重ねる
Next, draw a path freely. While drawing, the newest fibre appears at the top. As the total path grows longer, earlier positions have smaller normalized heights, so their fibres move down. Releasing the pointer fixes the path for inspection.
次は、自由に経路を描きます。描いている間は、新しいファイバーがいちばん上に現れます。経路が長くなると、以前の位置の正規化された高さが小さくなるので、そのファイバーは下へ移動します。ポインターを離すと、形を固定して観察できます。
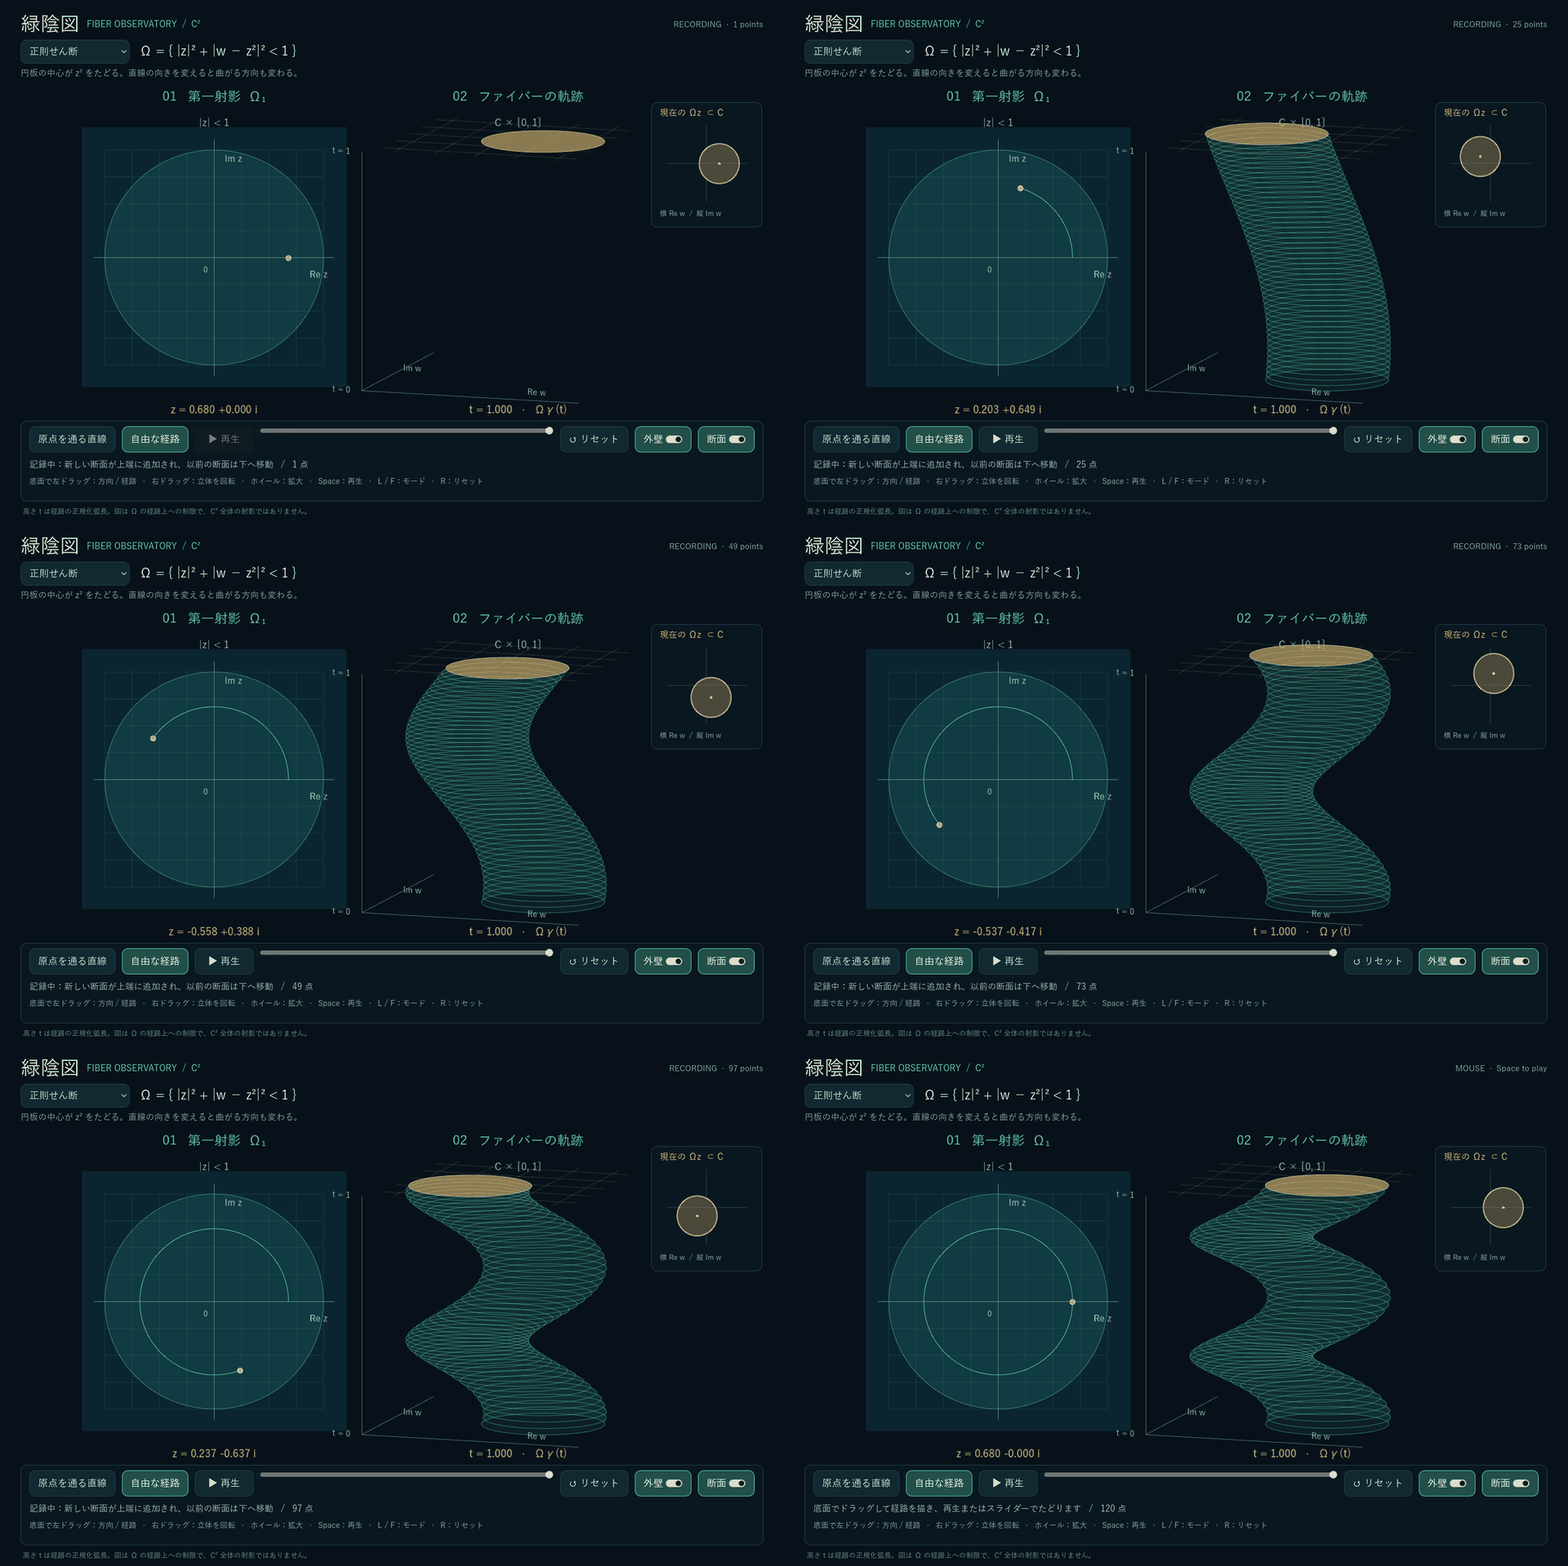
Play the GIF version (close to stop)GIF版を見る(閉じると停止)
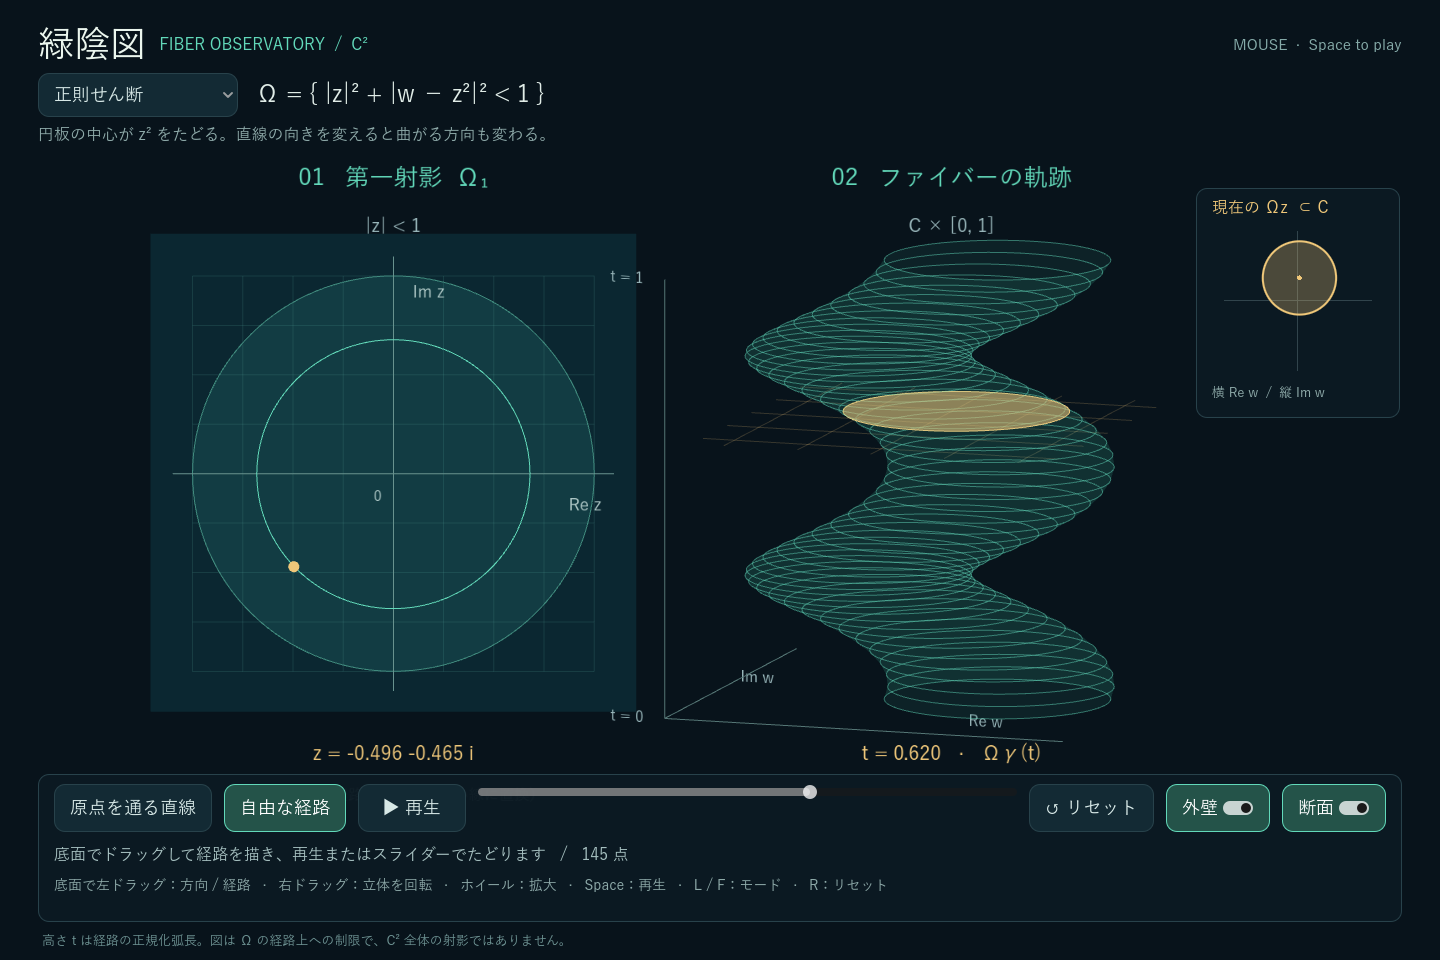
The disc centres are \(z^2\). As \(z\) travels once around a circle centred at the origin, the centre travels twice around the corresponding circle. Stacking the discs makes this winding visible.
この例では円板の中心が \(z^2\) にあります。\(z\) が原点を中心とする円を一周すると、中心は対応する円を二周します。円板を積み重ねることで、この回転の様子が見えてきます。
Replay the same path描いた経路を、もう一度たどる
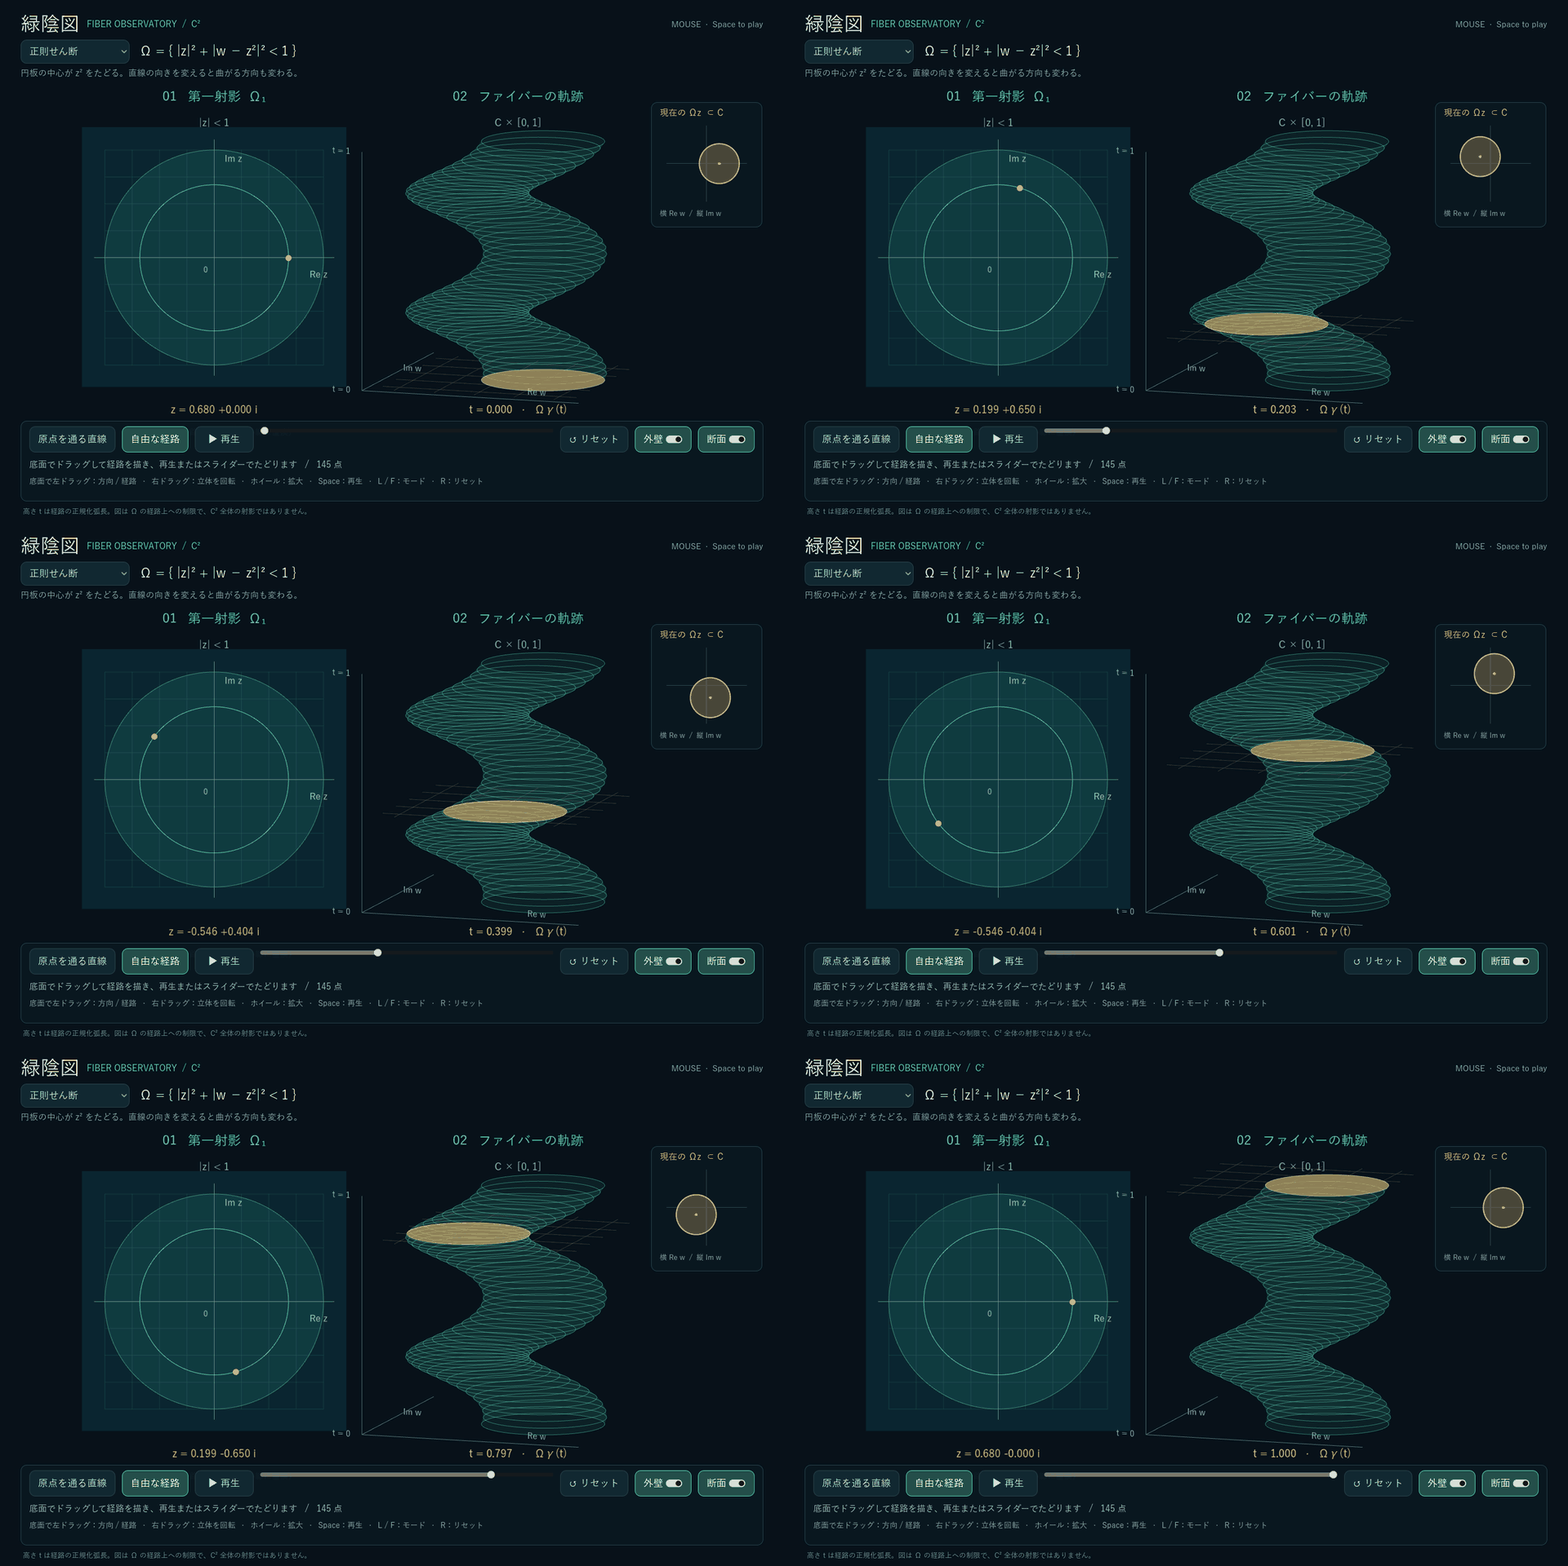
Play the GIF version (close to stop)GIF版を見る(閉じると停止)
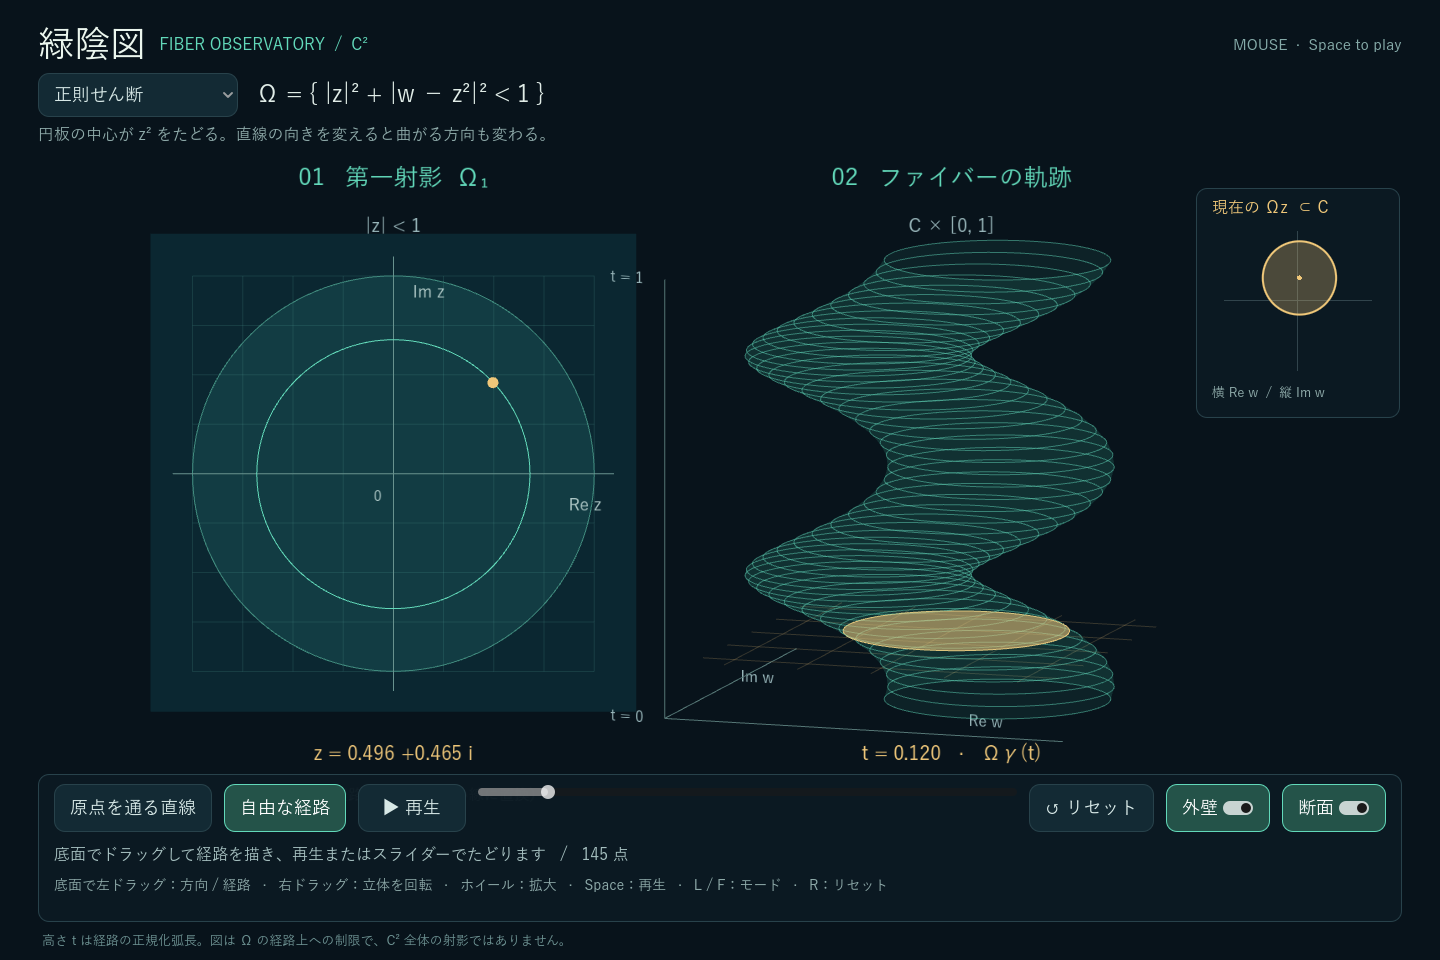
Compare four domains四つの例題を見比べる
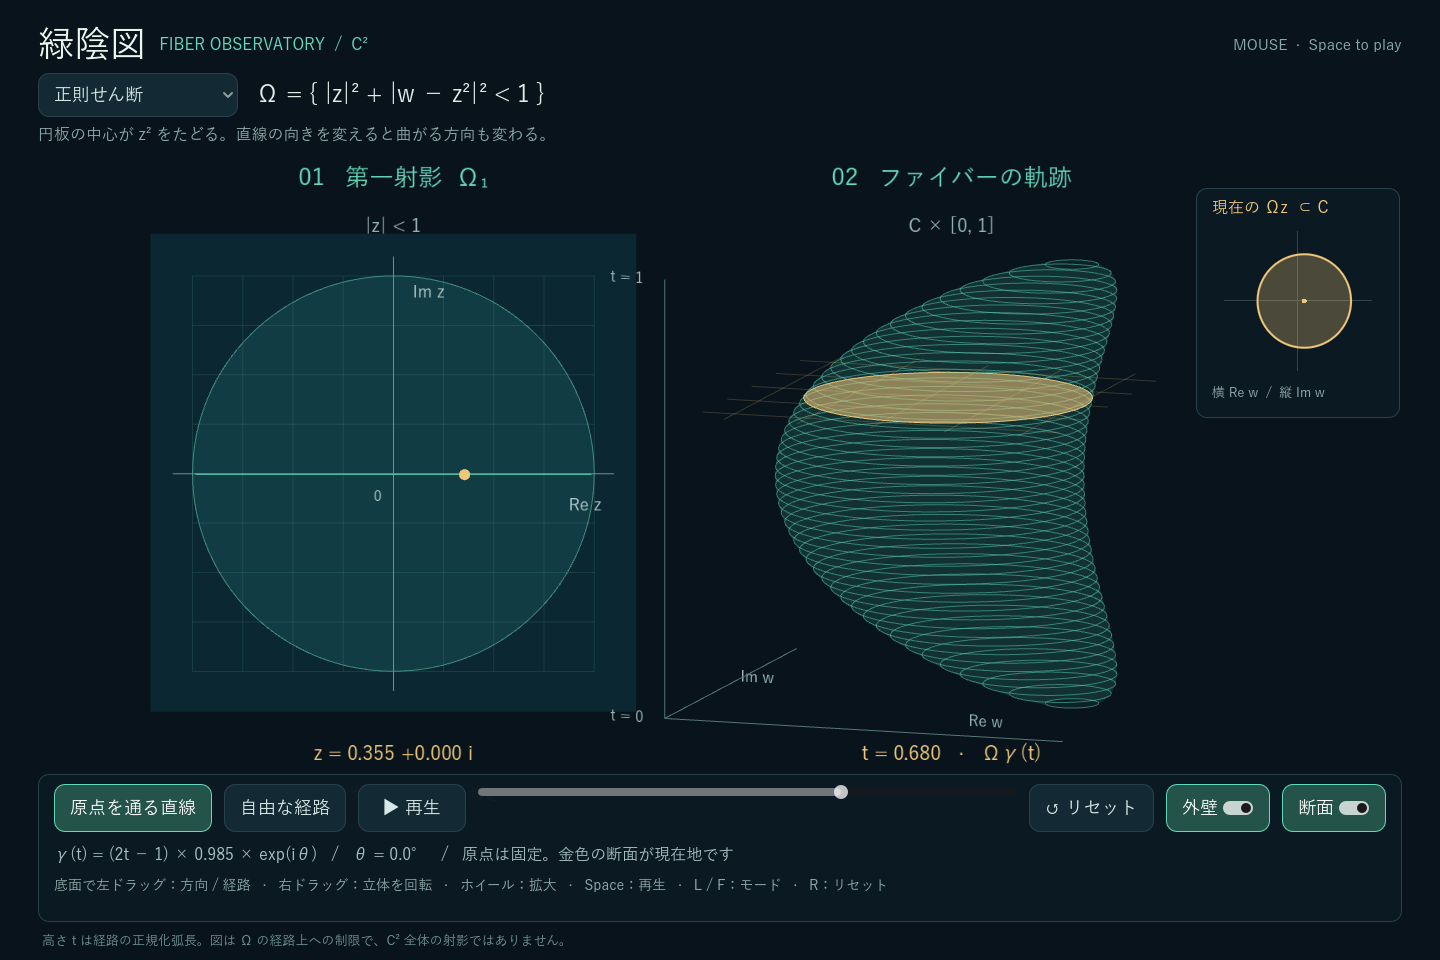
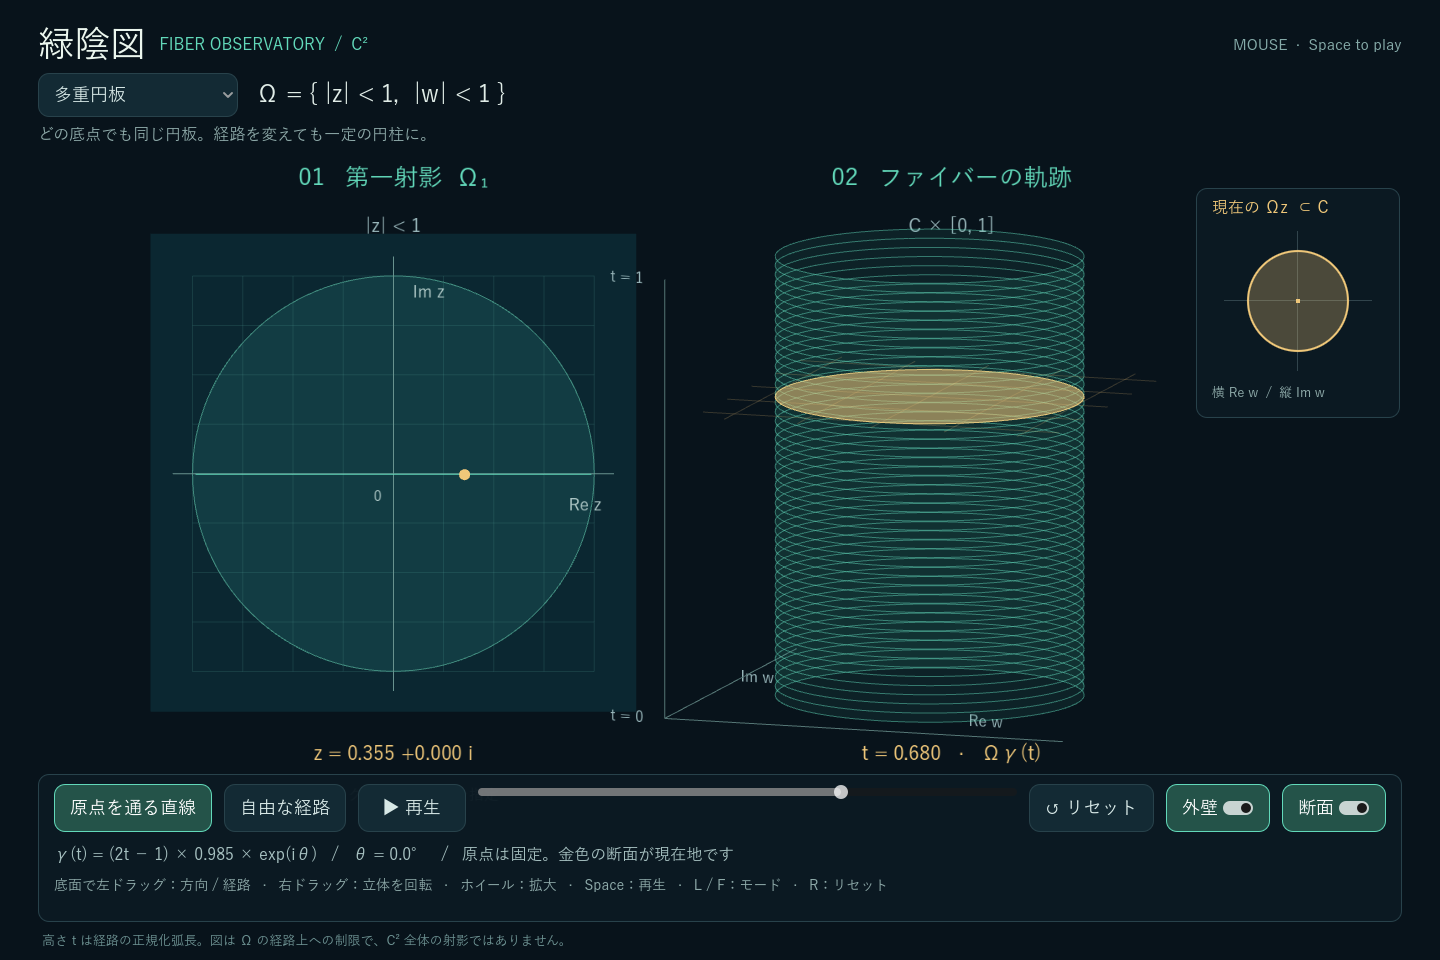
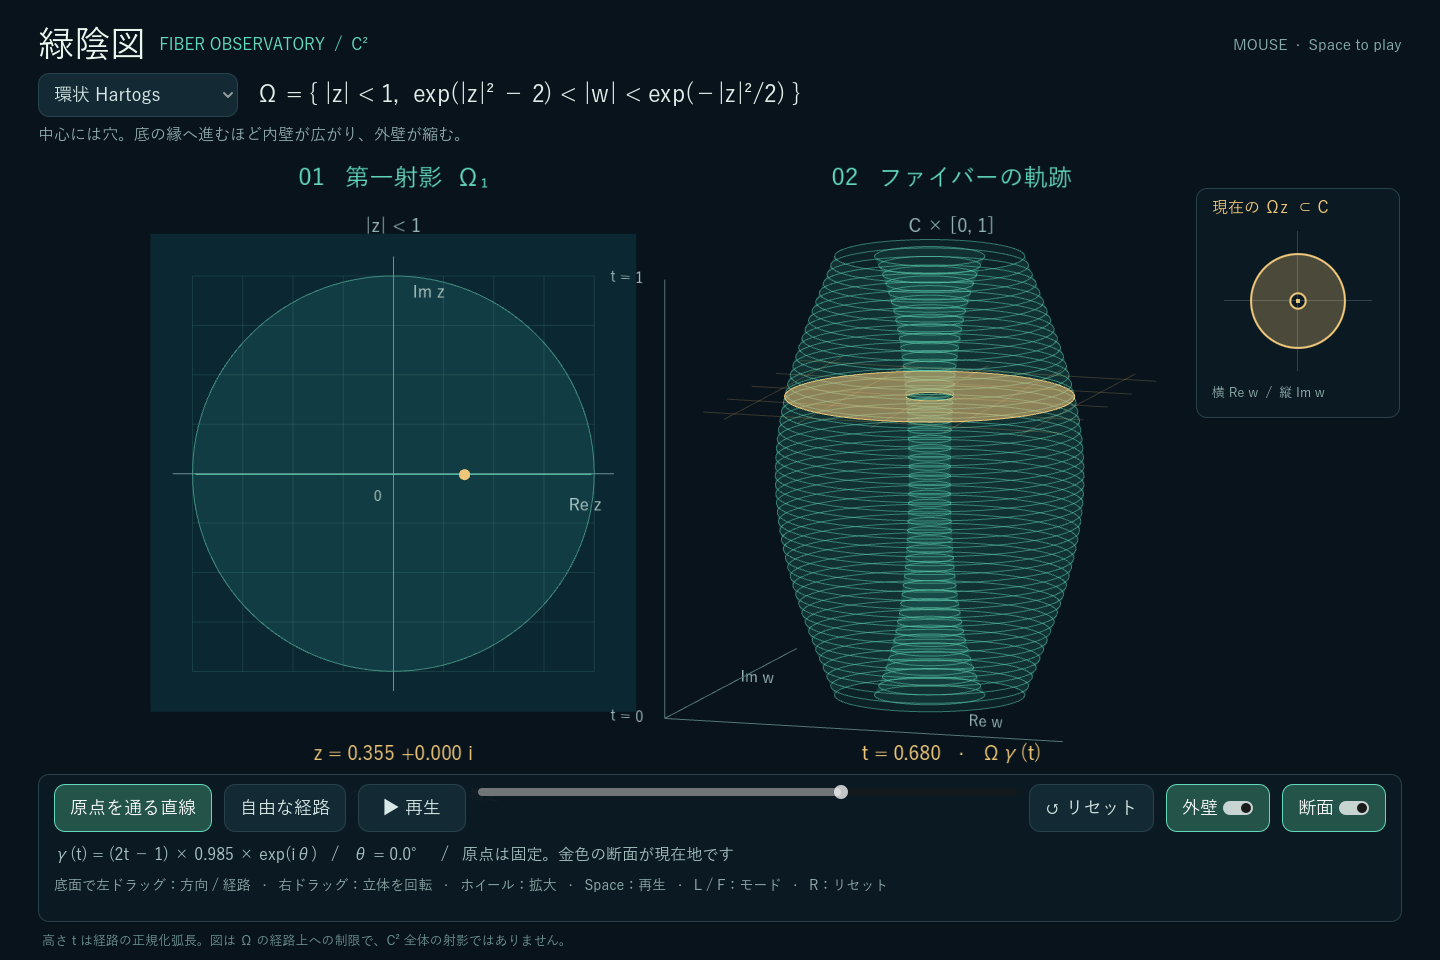
The prototype includes four examples. All have \(\Omega_1=\{|z|<1\}\), so we can keep the same base diagram and compare how the fibres change.
試作には四つの例題を用意しました。どれも第一射影は \(\Omega_1=\{|z|<1\}\) なので、同じ底の図でファイバーの変わり方を比較できます。
Unit ball単位球
A disc centred at 0, with radius \(\sqrt{1-|z|^2}\).
中心0、半径 \(\sqrt{1-|z|^2}\) の円板。
Holomorphic shear正則せん断
The same radius, with centre \(z^2\).
半径は単位球と同じで、中心が \(z^2\) に移る円板。
Bidisc多重円板
The unit disc at every base point.
底点によらず、いつも単位円板。
Annular Hartogs domain環状Hartogs領域
An annulus whose inner and outer radii vary with \(|z|\).
\(|z|\) に応じて内半径・外半径が変わる円環。
In VR, and with a mouseVRでも、マウスでも
The VR view has been checked on a Meta Quest connected to a PC. In the headset, the base diagram and the stacked fibres sit side by side, and a controller ray selects positions in the base.
Meta QuestをPCに接続した環境で、VR表示を確認しました。ヘッドセットの中では、底の図と積み重ねたファイバーを並べ、コントローラーの光線で底の位置を指定します。
In VRVRでの操作
- Right trigger: select the line direction or draw a path.右トリガー:直線の方向を指定/経路を描く。
- Right grip: switch between line and free-path modes.右グリップ:直線/自由経路を切り替える。
- Left trigger: play or stop. Left stick: move along the path.左トリガー:再生/停止。左スティック:経路上の位置を動かす。
- Left grip: change the example domain.左グリップ:例題領域を切り替える。
With a mouseマウスでの操作
- Drag in the left disc to choose a direction or draw.左の円内をドラッグして方向指定/自由描画。
- Use Play or the slider to follow the path.再生ボタンやスライダーで経路をたどる。
- Right-drag to rotate the stack; scroll to zoom.右ドラッグで立体を回転、ホイールで拡大・縮小。
- Switch the walls and section outlines on or off.外壁・断面の表示を切り替える。
The images and movies on this page are desktop renderings. The movies use scripted paths through the actual Godot application; they are not headset recordings. The app runs on the PC; this page introduces it through recorded material.
このページの画像・動画はPC版の描画です。動画では、実際のGodotアプリに経路を与えて動きを収録しています。ヘッドセット内の録画ではありません。アプリはPC上で動作し、このページでは記録した素材で紹介しています。
How did we build it?対話しながら、どう作った?
The work was led by the three members credited above. We began by describing the mathematics and the desired interaction to Chapio-kun (ChatGPT), with Codex used for implementation: choose a point in the first projection, display its fibre, then make the fibres move vertically as a path is drawn. A line through the origin was proposed as a first step; the prototype now includes both line and free-path modes.
上記の3名を中心に進めた制作は、第一射影の点を選んでファイバーを見ること、さらに経路に応じてファイバーが縦に動く様子を見たいことを、ちゃぴおくん(ChatGPT)に伝え、Codexでの実装を依頼するところから始めました。最初の段階として原点を通る直線も提案し、試作では直線モードと自由経路モードの両方を用意しました。
We first checked the examples and mouse interaction, then worked through the PC VR connection and checked the result in the headset. The dialogue moved between mathematical intent, what appeared on screen, and how to operate it.
まず例題とマウス操作で図の対応を確かめ、その後PC VRの接続を調整し、ヘッドセットで確認しました。数学的に何を見たいか、実際にどう表示されるか、どう操作するかを行き来しながら作っています。
How the displayed surfaces are sampled断面と外壁の描画について
The four examples use explicit disc or annulus fibres. Each circular boundary is sampled at 96 vertices; the stacked view uses 49 sections, joined by triangles for the translucent walls. These surfaces approximate the geometry. The boundary outlines are guides and are not included in the open domain.
四つの例題では、円板・円環のファイバーを解析式から計算しています。円周は96分割、積み重ねは49断面を使い、その間を三角形でつないで半透明の外壁を描きます。表示は近似であり、輪郭線が示す境界は開領域には含みません。
Height and the complex plane use independent display scales. The current renderer handles disc and annulus fibres; noncircular, splitting or branching fibres would need another section generator.
高さと複素平面には独立した表示倍率を使います。現在の描画は円板・円環のファイバーに対応しており、非円形の断面や、分裂・分岐するファイバーには別の断面生成が必要です。
How would we like to use it?この先、どう使いたい?
We would like to use the view to compare what changes with the domain and what changes with the path. A constant fibre, a changing radius, a moving centre, and a persistent hole offer four different starting points for observation.
今後は、領域を変えると何が変わるか、経路を変えると何が変わるかを見比べる道具として使いたいと考えています。一定のファイバー、半径の変化、中心の移動、穴のある断面が、それぞれ観察の入口になります。
VR also lets us change our viewpoint as we compare the base diagram and the stacked family. We want to explore how this helps connect an individual fibre with the family along a path.
VRでは、底の図とファイバーの集まりを見比べながら、見る位置を変えられます。一つの断面と経路全体の対応を捉えるうえで、この見方がどう役立つかを試していきたいと思います。
Sources and related visualizations出典と関連する可視化
The starting idea was Kiyoshi Oka’s “ryokuinzu.” For an account, see Toshio Nishino, “岡潔先生の数学,” Sugaku 33(2) (1981), 171–178, especially pp. 174–175. DOI: 10.11429/sugaku1947.33.171 · J-STAGE (PDF).
着想の出発点は、岡潔の「緑陰図」です。参考文献:西野利雄「岡潔先生の数学」『数学』33巻2号(1981)、171–178頁、とくに174–175頁。DOI: 10.11429/sugaku1947.33.171 · J-STAGE(PDF)。
Built with Godot 4.7.2 and OpenXR. See the Godot XR setup documentation for the underlying XR framework.
制作環境はGodot 4.7.2とOpenXRです。XRの基本構成については、Godot公式ドキュメントを参照できます。
In the related browser game “Ryokuinzu — Pseudoconvex?”, move points, follow changing fibres and predict pseudoconvexity. Practise reading these diagrams on your own device and use the experience to think about what to observe in this Godot visualization.
関連するブラウザゲーム「緑陰図 — Pseudoconvex?」では、点を動かして切り口の変化を追い、擬凸性を予想します。手元で図の読み取りを練習し、このGodot可視化で何を見たいかを考える入口としても遊べます。